Grafana Loki开源日志聚合系统代替ELK或EFK

前言
在对公司容器云的日志方案进行设计的时候,发现主流的 ELK (Elasticsearch, Logstash, Kibana) 或者 EFK (Elasticsearch, Filebeat or Fluentd, Kibana) 比较重,再加上现阶段对于 ES 复杂的搜索功能很多都用不上,最终选择了 Grafana 开源的 Loki 日志系统。下面我们来介绍下 Loki 的一些基本概念和架构,当然 EFK 作为业界成熟的日志聚合解决方案也是大家应该需要熟悉和掌握的。
Loki 2.0 released: Transform logs as you’re querying them, and set up alerts within Loki, Loki 2.0 大版本更新后更好用了
更新历史
2020年11月02日 - 初稿
阅读原文 - https://wsgzao.github.io/post/loki/
Loki简介
Grafana Loki is a set of components that can be composed into a fully featured logging stack.
Unlike other logging systems, Loki is built around the idea of only indexing metadata about your logs: labels (just like Prometheus labels). Log data itself is then compressed and stored in chunks in object stores such as S3 or GCS, or even locally on the filesystem. A small index and highly compressed chunks simplifies the operation and significantly lowers the cost of Loki.
Loki 是 Grafana Labs 团队最新的开源项目,是一个水平可扩展,高可用性,多租户的日志聚合系统。它的设计非常经济高效且易于操作,因为它不会为日志内容编制索引,而是为每个日志流编制一组标签,专门为 Prometheus 和 Kubernetes 用户做了相关优化。该项目受 Prometheus 启发,官方的介绍就是: Like Prometheus,But For Logs.,类似于 Prometheus 的日志系统。
项目地址:https://github.com/grafana/loki/
与其他日志聚合系统相比, Loki 具有下面的一些特性:
不对日志进行全文索引。通过存储压缩非结构化日志和仅索引元数据,Loki 操作起来会更简单,更省成本。
通过使用与 Prometheus 相同的标签记录流对日志进行索引和分组,这使得日志的扩展和操作效率更高。
特别适合储存 Kubernetes Pod 日志; 诸如 Pod 标签之类的元数据会被自动删除和编入索引。
受 Grafana 原生支持。
背景和动机
当我们的容器云运行的应用或者某个节点出现问题了,解决思路应该如下:
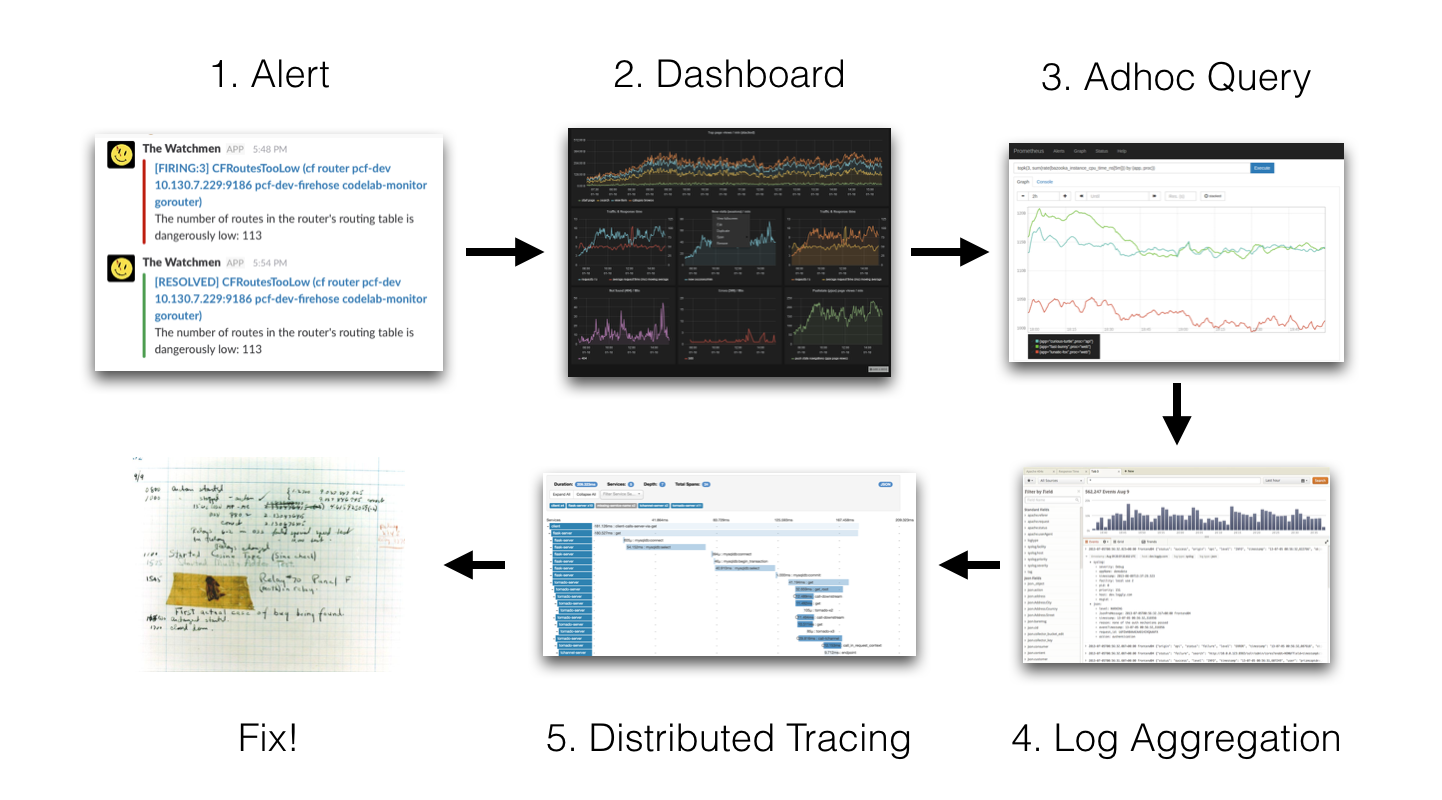
我们的监控使用的是基于 Prometheus 体系进行改造的,Prometheus 中比较重要的是 Metric 和 Alert,Metric 是来说明当前或者历史达到了某个值,Alert 设置 Metric 达到某个特定的基数触发了告警,但是这些信息明显是不够的。
我们都知道,Kubernetes 的基本单位是 Pod,Pod 把日志输出到 Stdout 和 Stderr,平时有什么问题我们通常在界面或者通过命令查看相关的日志。
举个例子:当我们的某个 Pod 的内存变得很大,触发了我们的 Alert。这时管理员,去页面查询确认是哪个 Pod 有问题,然后要确认 Pod 内存变大的原因,我们还需要去查询 Pod 的日志,如果没有日志系统,那么我们就需要到页面或者使用命令进行查询:
如果,这个时候应用突然挂了,这个时候我们就无法查到相关的日志了。所以需要引入日志系统,统一收集日志。而使用 ELK 的话,就需要在 Kibana 和 Grafana 之间切换,影响用户体验。所以 ,Loki 的第一目的就是最小化度量和日志的切换成本,有助于减少异常事件的响应时间和提高用户的体验。
ELK 存在的问题
现有的很多日志采集的方案都是采用全文检索对日志进行索引(如 ELK 方案),优点是功能丰富,允许复杂的操作。但是,这些方案往往规模复杂,资源占用高,操作苦难。很多功能往往用不上,大多数查询只关注一定时间范围和一些简单的参数(如:host、service 等),使用这些解决方案就有点杀鸡用牛刀的感觉了。

因此,Loki 的第二个目的是,在查询语言的易操作性和复杂性之间可以达到一个权衡。
成本考量
全文检索的方案也带来成本问题,简单的说就是全文搜索(如:ES)的倒排索引的切分和共享的成本较高。后来出现了其他不同的设计方案,如:
- OKlog
项目地址:https://github.com/oklog/oklog
采用最终一致的、基于网格的分布策略。这两个设计决策提供了大量的成本降低和非常简单的操作,但是查询不够方便。因此,Loki 的第三个目的是,提供一个更具成本效益的解决方案。
整体架构
Loki 的架构如下:
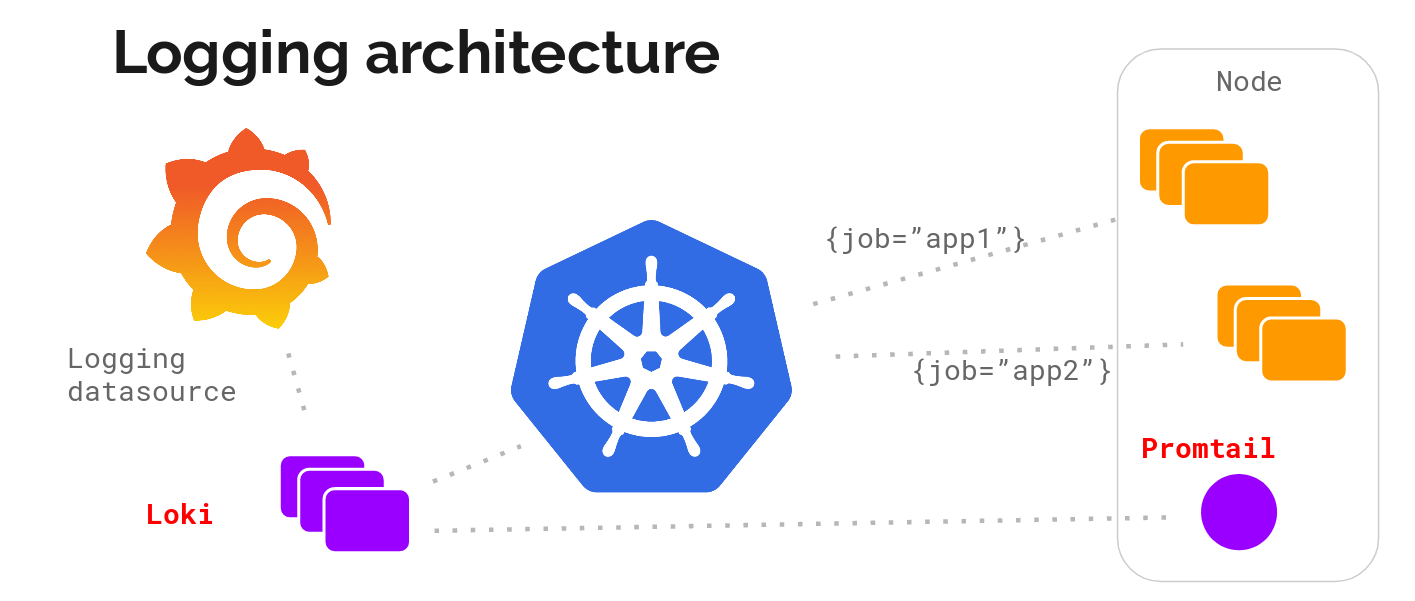
不难看出,Loki 的架构非常简单,主要由以下 3 个部分组成:
Loki 是主服务器,负责存储日志和处理查询。
Promtail是代理,负责收集日志并将其发送给 Loki 。
Grafana 用于 UI 展示。
Loki 使用了和 Prometheus 一样的标签来作为索引。也就是说,你通过这些标签既可以查询日志的内容也可以查询到监控的数据,不但减少了两种查询之间的切换成本,也极大地降低了日志索引的存储。
Loki 使用与 Prometheus 相同的服务发现和标签重新标记库,编写了 Pormtail。在 Kubernetes 中 Promtail 以 DaemonSet 方式运行在每个节点中,通过 Kubernetes API 得到日志的正确元数据,并将它们发送到 Loki。下面是日志的存储架构:
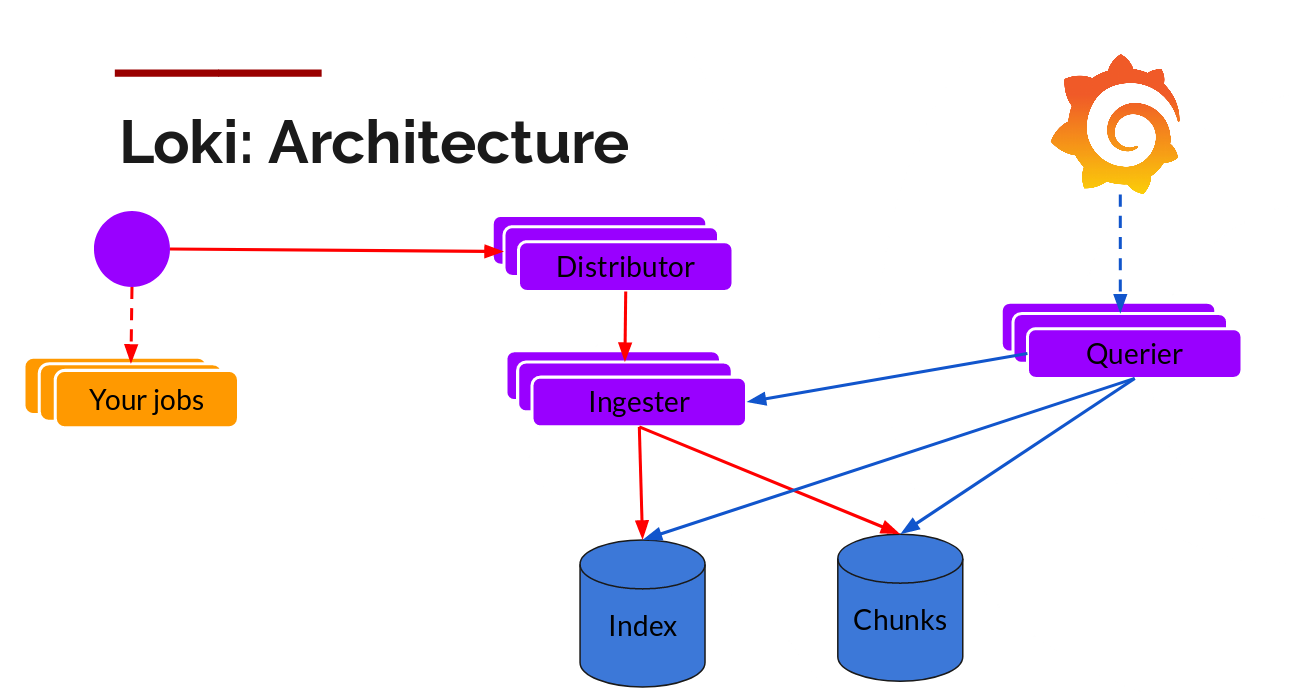
读写
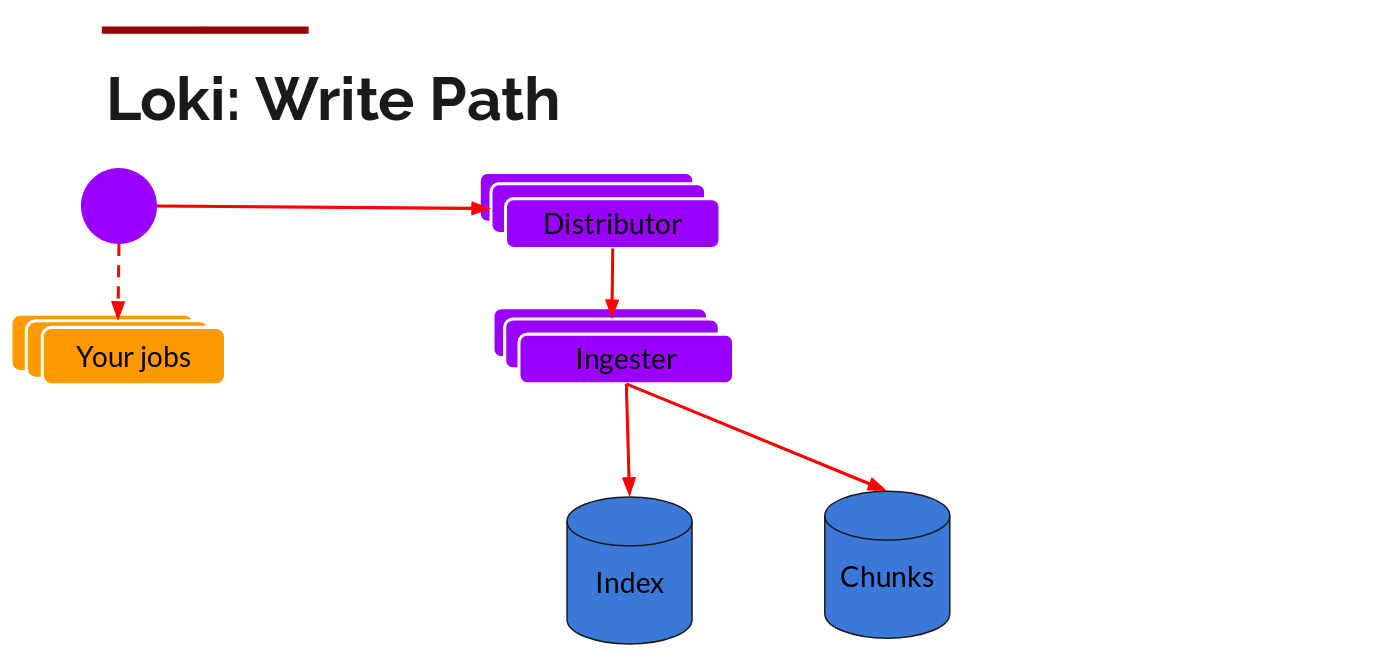
日志数据的写主要依托的是 Distributor 和 Ingester 两个组件,整体的流程如下:
Distributor
一旦 Promtail 收集日志并将其发送给 Loki,Distributor 就是第一个接收日志的组件。由于日志的写入量可能很大,所以不能在它们传入时将它们写入数据库。这会毁掉数据库。我们需要批处理和压缩数据。
Loki 通过构建压缩数据块来实现这一点,方法是在日志进入时对其进行 Gzip 操作。组件 Ingester 是一个有状态的组件,负责构建和刷新 Chunck,当 Chunk 达到一定的数量或者时间后,刷新到存储中去。每个流的日志对应一个 Ingester,当日志到达 Distributor 后,根据元数据和 Hash 算法计算出应该到哪个 Ingester 上面。
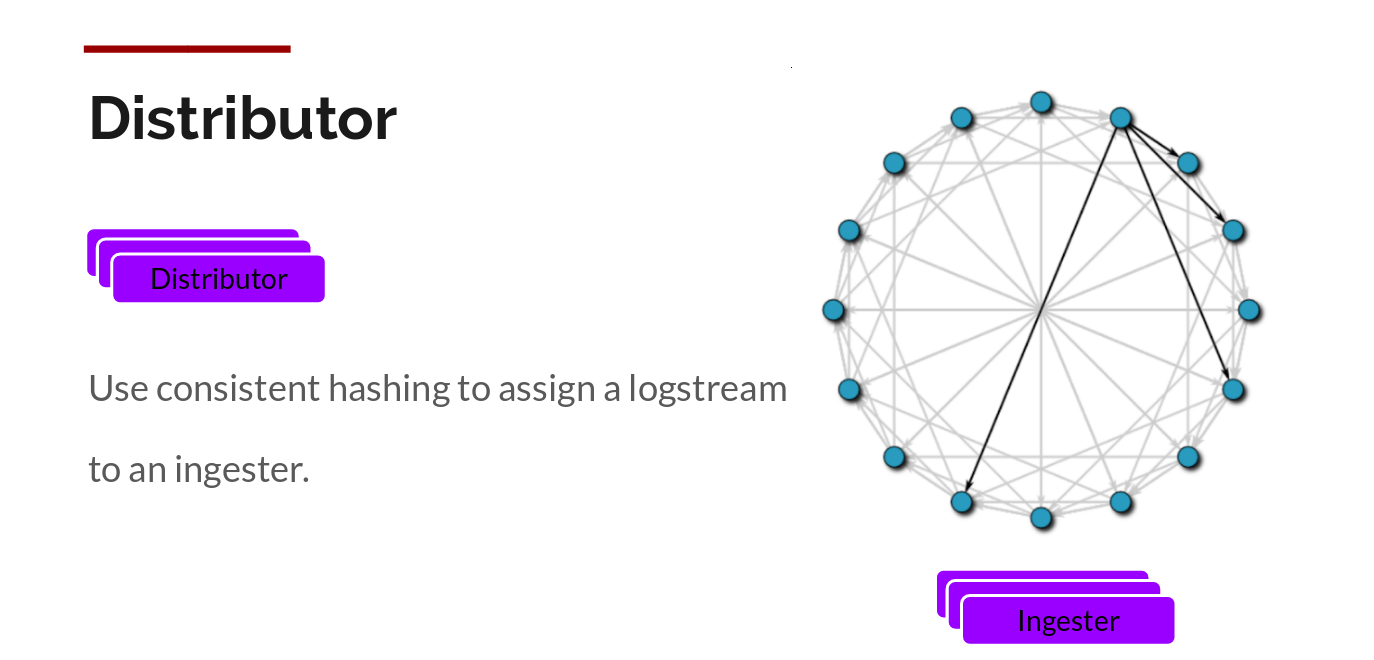
此外,为了冗余和弹性,我们将其复制 n(默认情况下为 3)次。
Ingester
Ingester 接收到日志并开始构建 Chunk:
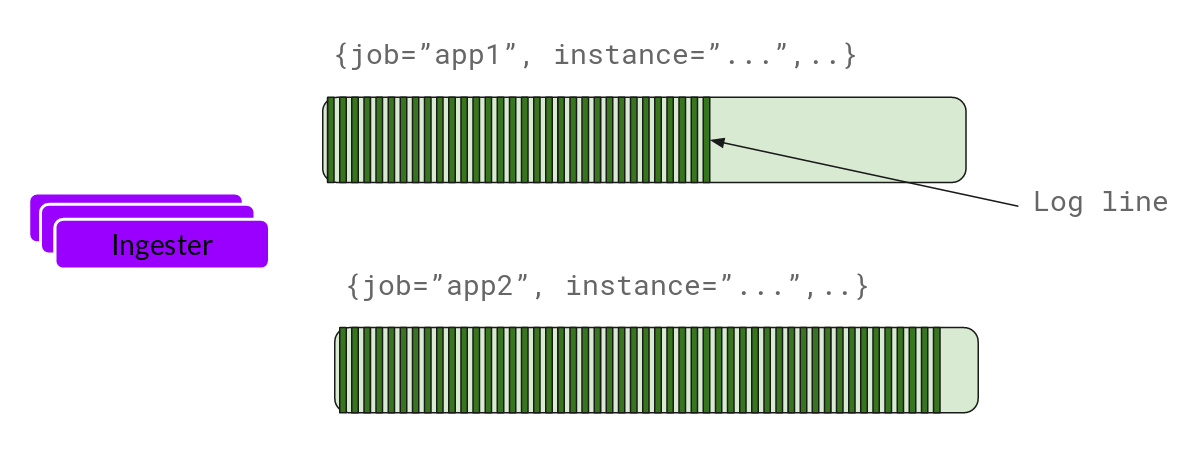
基本上就是将日志进行压缩并附加到 Chunk 上面。一旦 Chunk 填满(数据达到一定数量或者过了一定期限),Ingester 将其刷新到数据库。我们对块和索引使用单独的数据库,因为它们存储的数据类型不同。
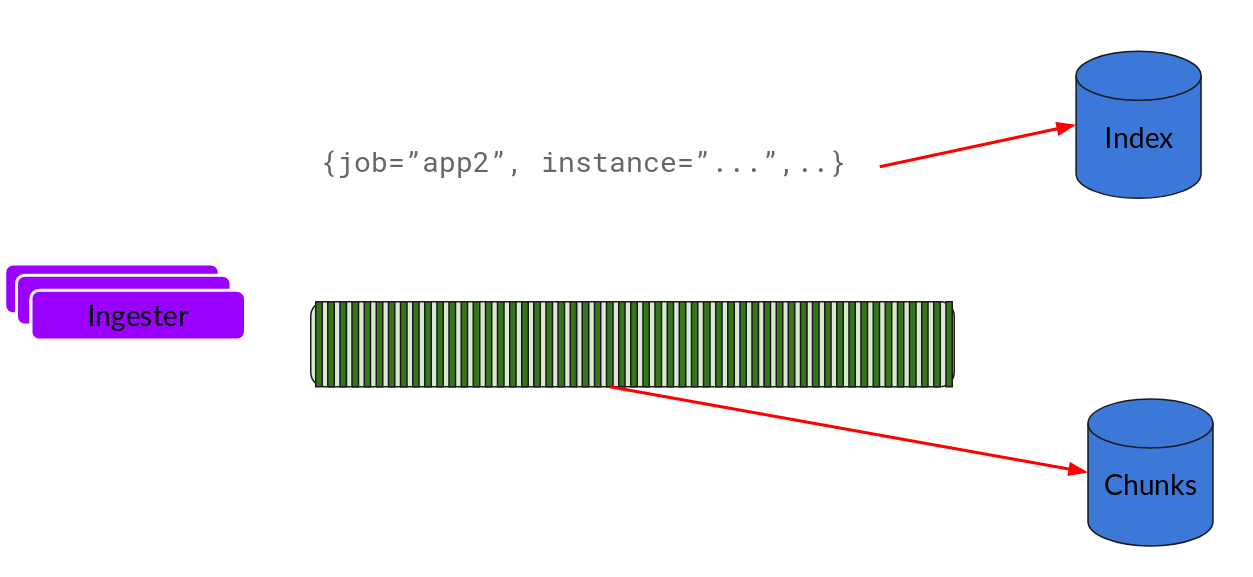
刷新一个 Chunk 之后,Ingester 然后创建一个新的空 Chunk 并将新条目添加到该 Chunk 中。
Querier
读取就非常简单了,由 Querier 负责给定一个时间范围和标签选择器,Querier 查看索引以确定哪些块匹配,并通过 Greps 将结果显示出来。它还从 Ingester 获取尚未刷新的最新数据。
对于每个查询,一个查询器将为您显示所有相关日志。实现了查询并行化,提供分布式 Grep,使即使是大型查询也是足够的。
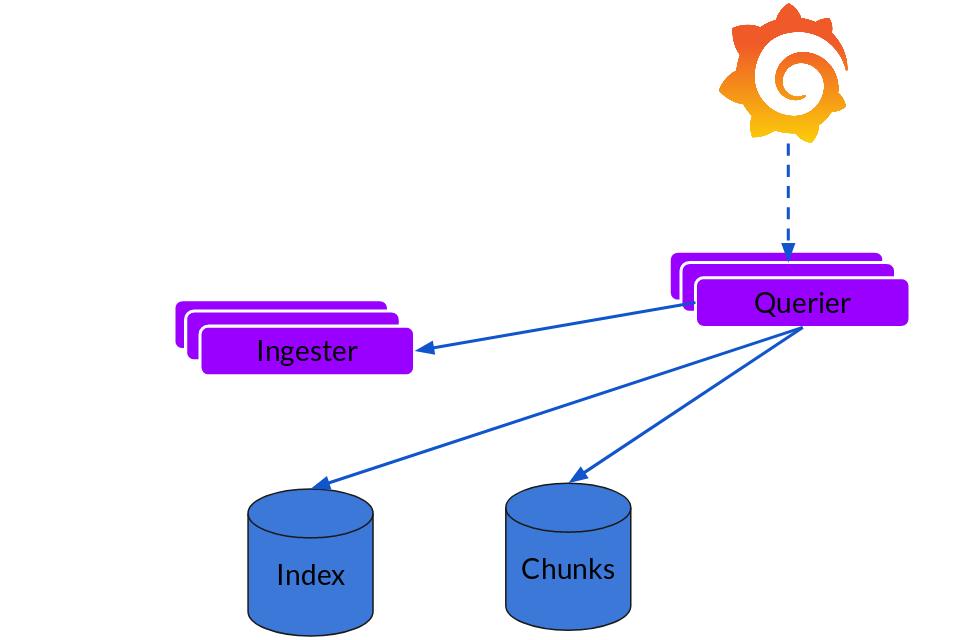
可扩展性
Loki 的索引存储可以是 Cassandra/Bigtable/Dynamodb,而 Chuncks 可以是各种对象存储,Querier 和 Distributor 都是无状态的组件。
对于 Ingester,它虽然是有状态的。但是,当新的节点加入或者减少,整节点间的 Chunk 会重新分配,已适应新的散列环。而 Loki 底层存储的实现 Cortex 已经在实际的生产中投入使用多年了。
安装Loki
Installation methods
Instructions for different methods of installing Loki and Promtail.
- Install using Tanka (recommended)
- Install through Helm
- Install through Docker or Docker Compose
- Install and run locally
- Install from source
General process
In order to run Loki, you must:
- Download and install both Loki and Promtail.
- Download config files for both programs.
- Start Loki.
- Update the Promtail config file to get your logs into Loki.
- Start Promtail.
Loki官方已经写得很详细了,我以docker-compose为例做个简单的演示
Install with Docker Compose
1 | version: "3" |
Run the following commands in your command line. They work for Windows or Linux systems.
1 | wget https://raw.githubusercontent.com/grafana/loki/v2.0.0/production/docker-compose.yaml -O docker-compose.yaml |
Loki使用
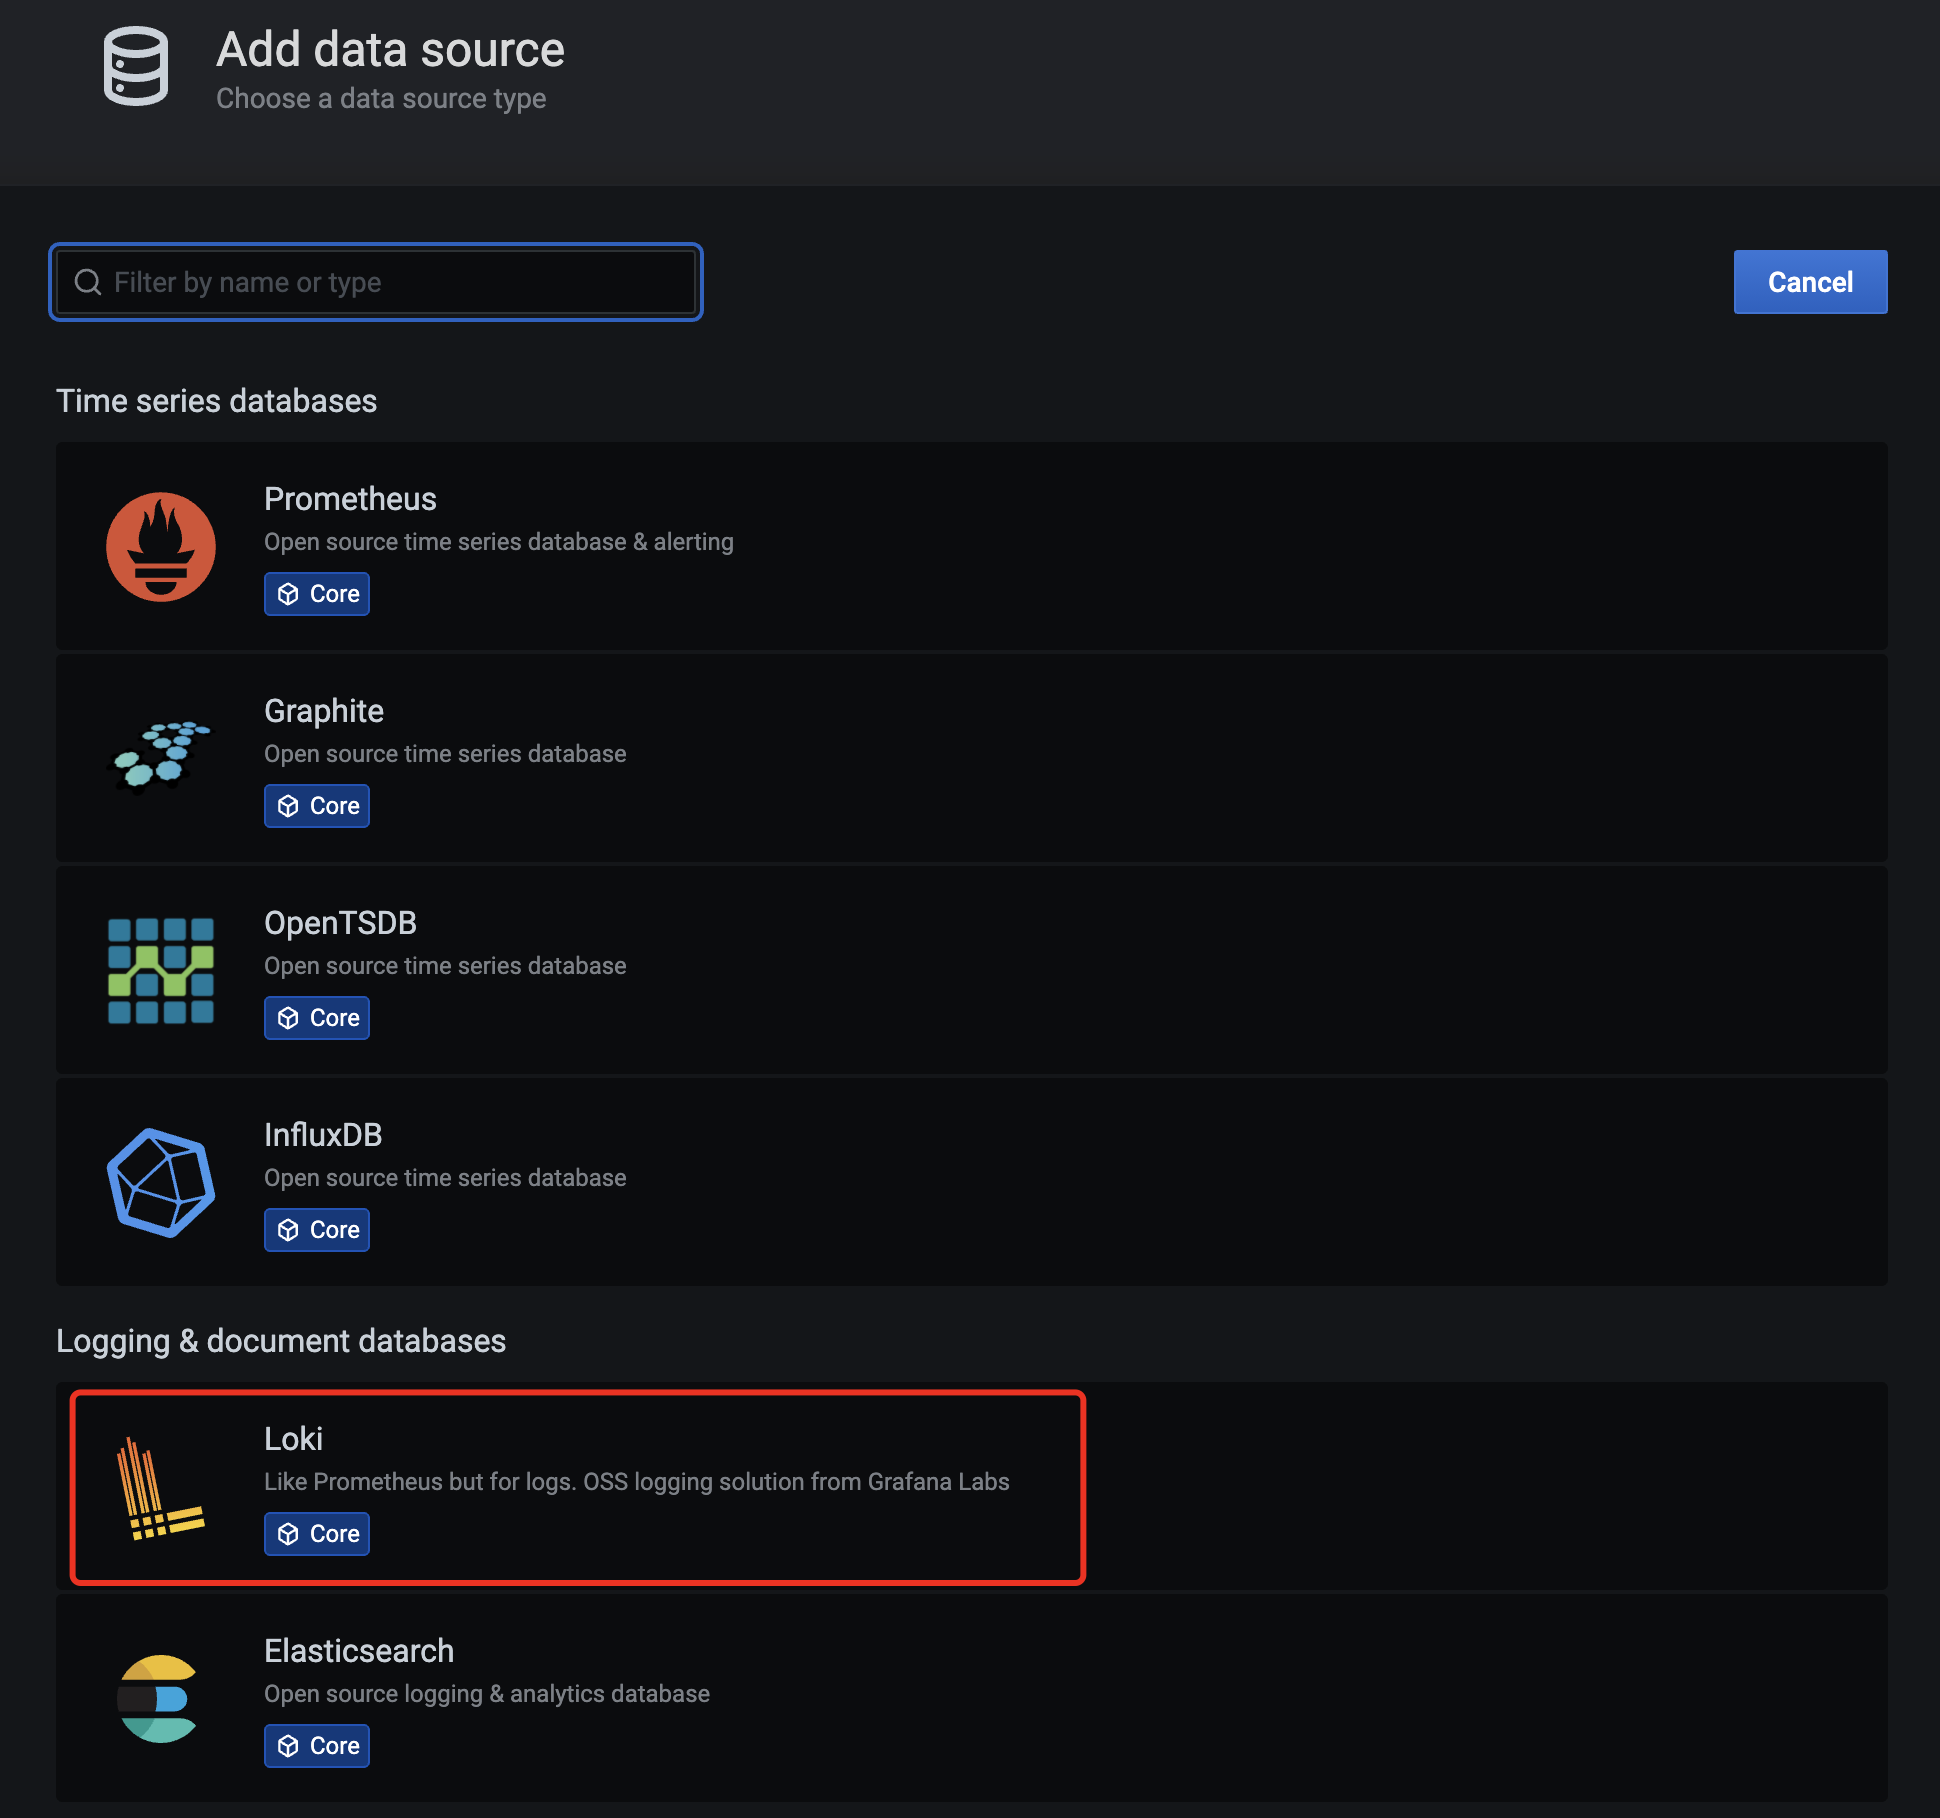
安装完成后,访问上面节点的 3000 端口访问 grafana,默认情况下使用(admin:admin)访问 -> 选择添加数据源:
grafana-loki-dashsource
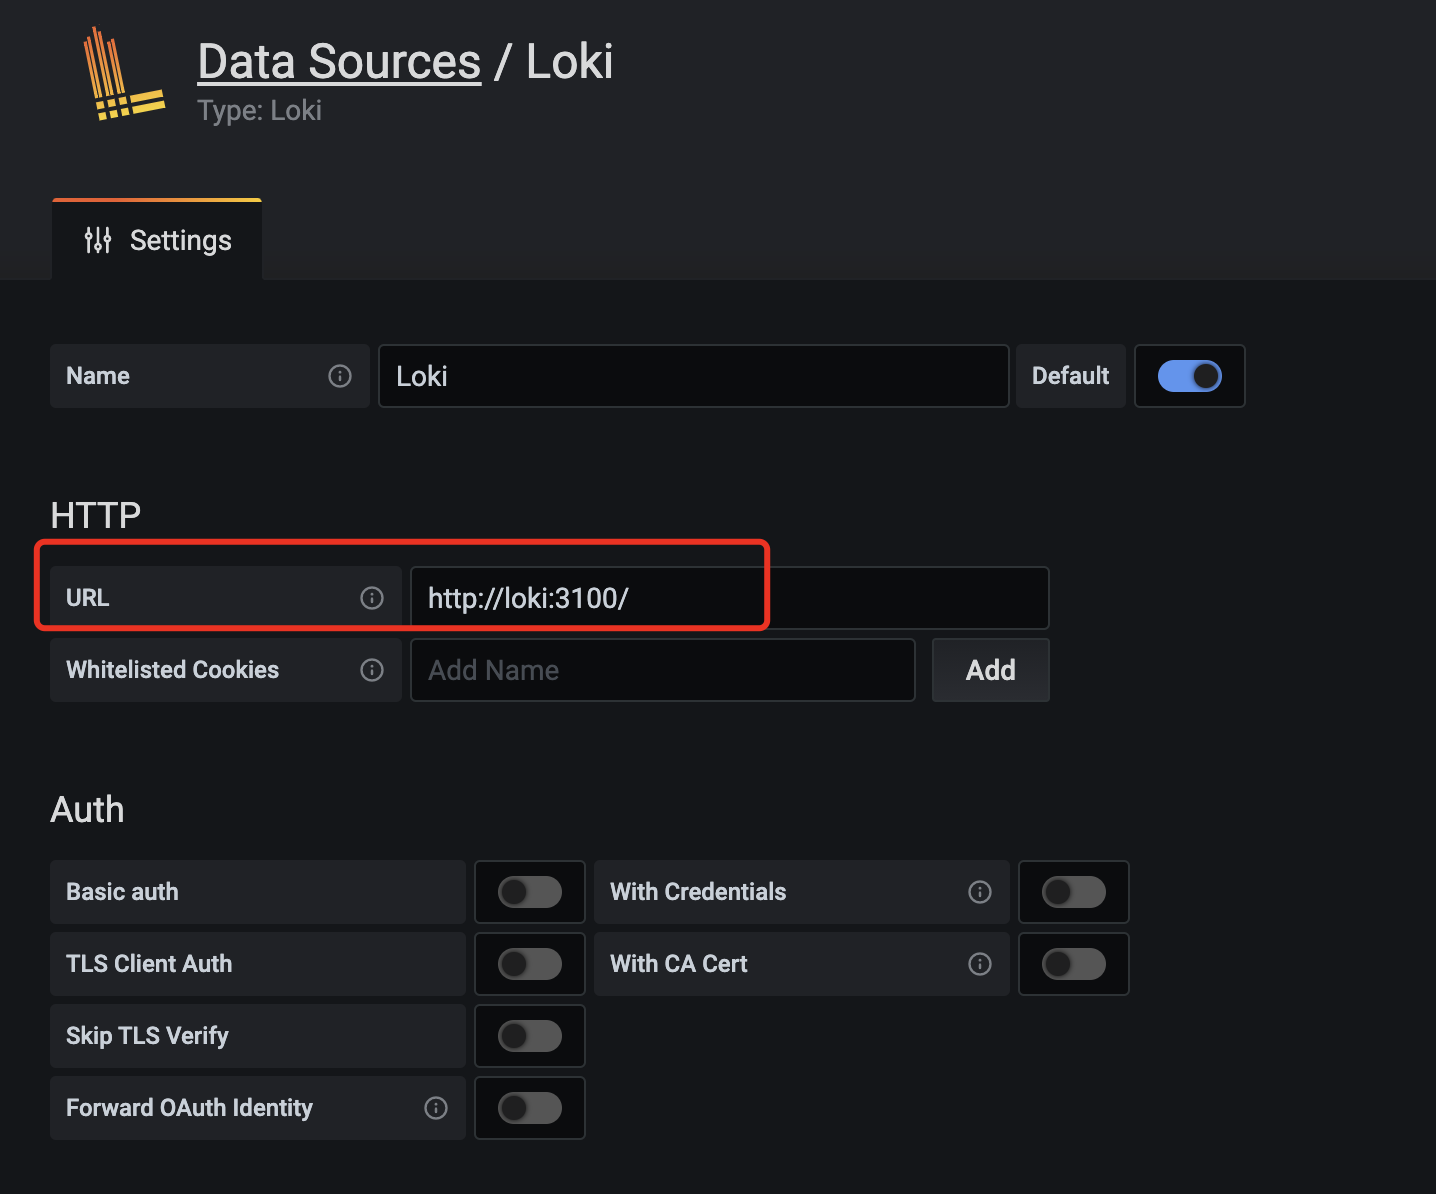
在数据源列表中选择Loki,配置 Loki 源地址:
grafana-loki-dashsource-config
源地址配置http://loki:3100即可,保存。
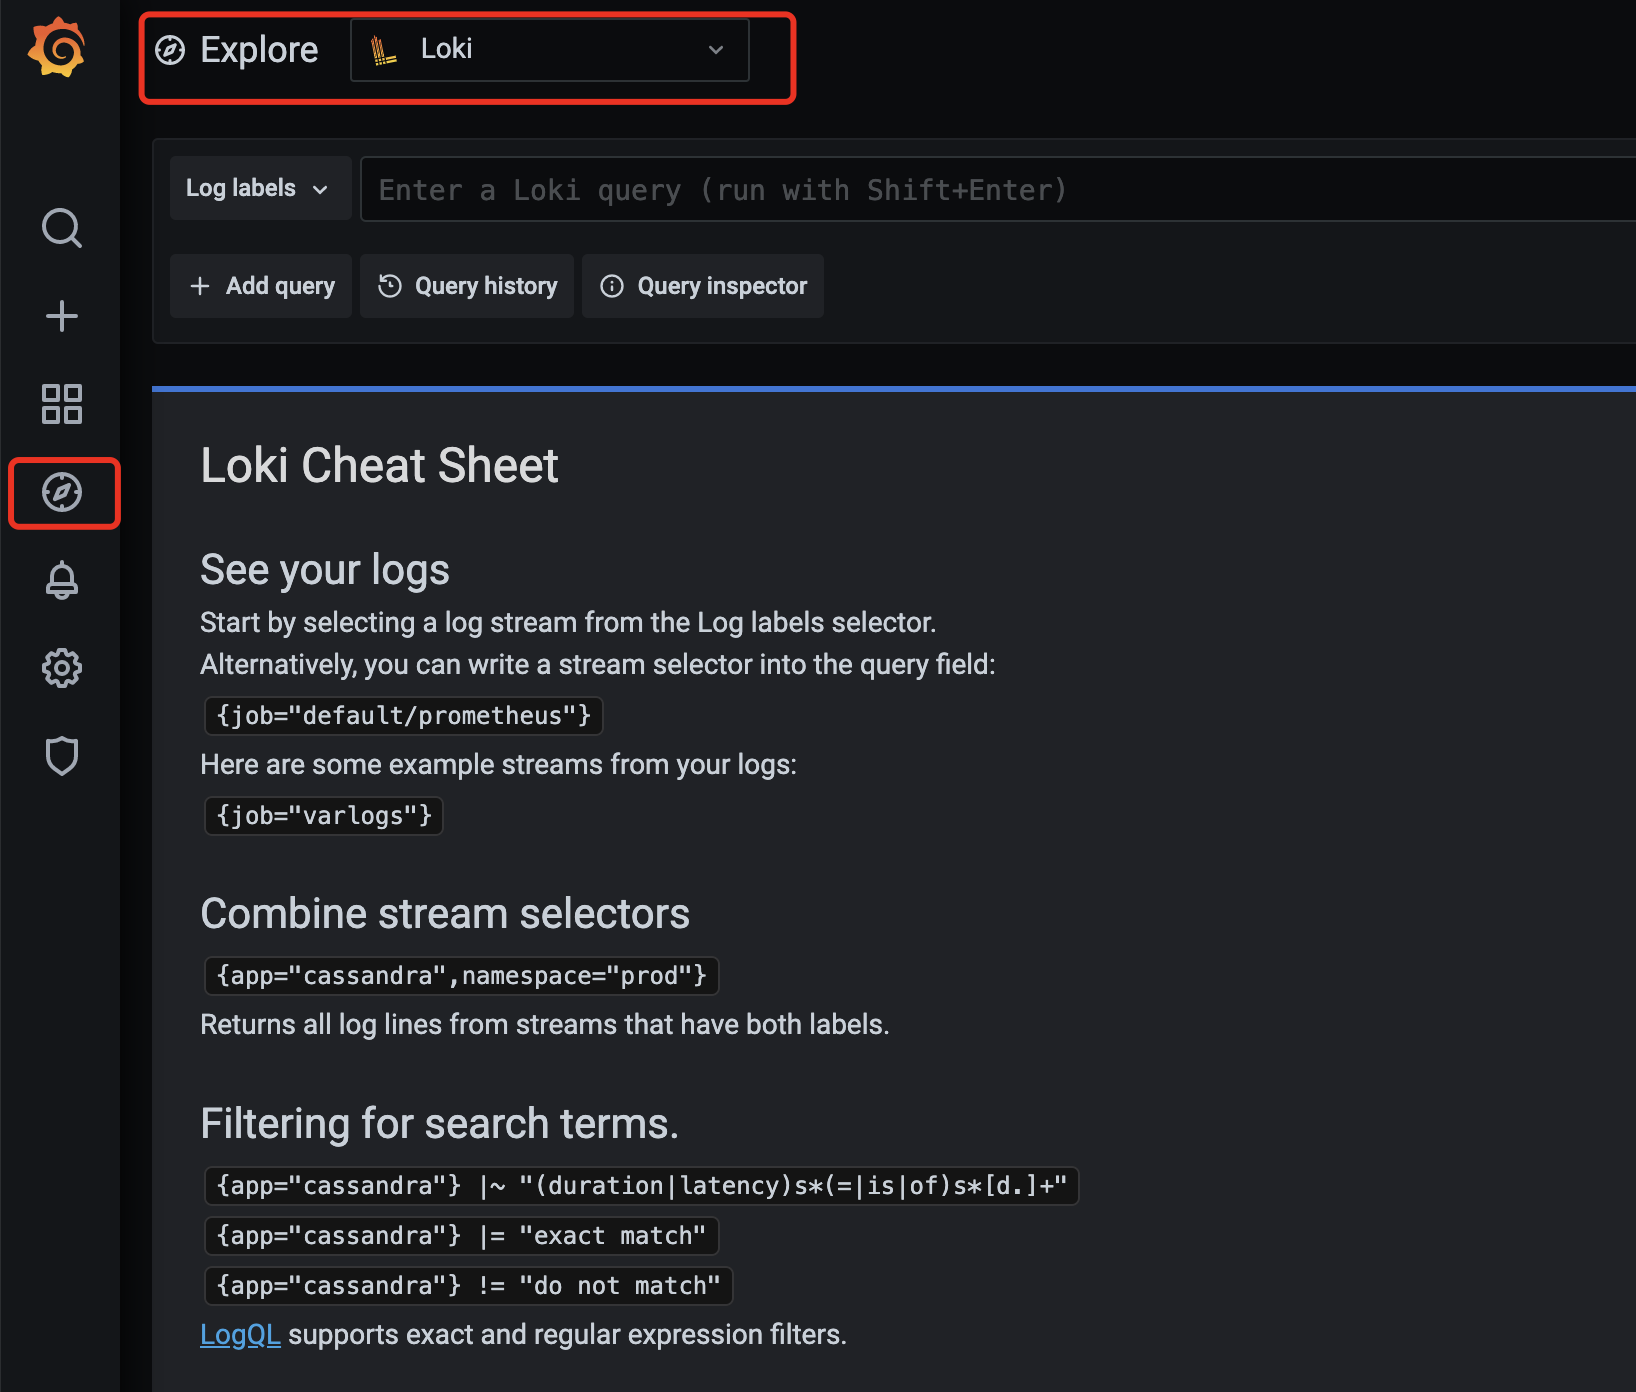
保存完成后,切换到 grafana 左侧区域的Explore,即可进入到Loki的页面:
grafana-loki
然后我们点击Log labels就可以把当前系统采集的日志标签给显示出来,可以根据这些标签进行日志的过滤查询:
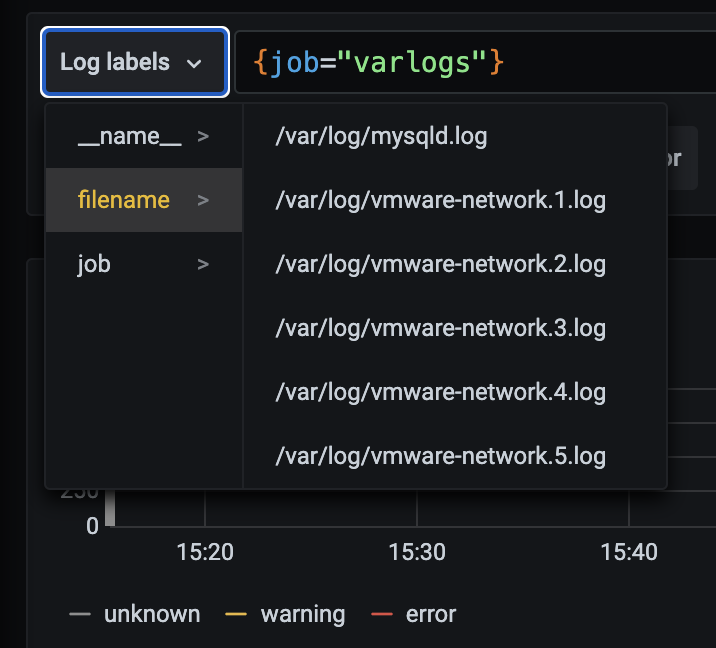
grafana-loki-log-labels
比如我们这里选择/var/log/messages,就会把该文件下面的日志过滤展示出来,不过由于时区的问题,可能还需要设置下时间才可以看到数据:
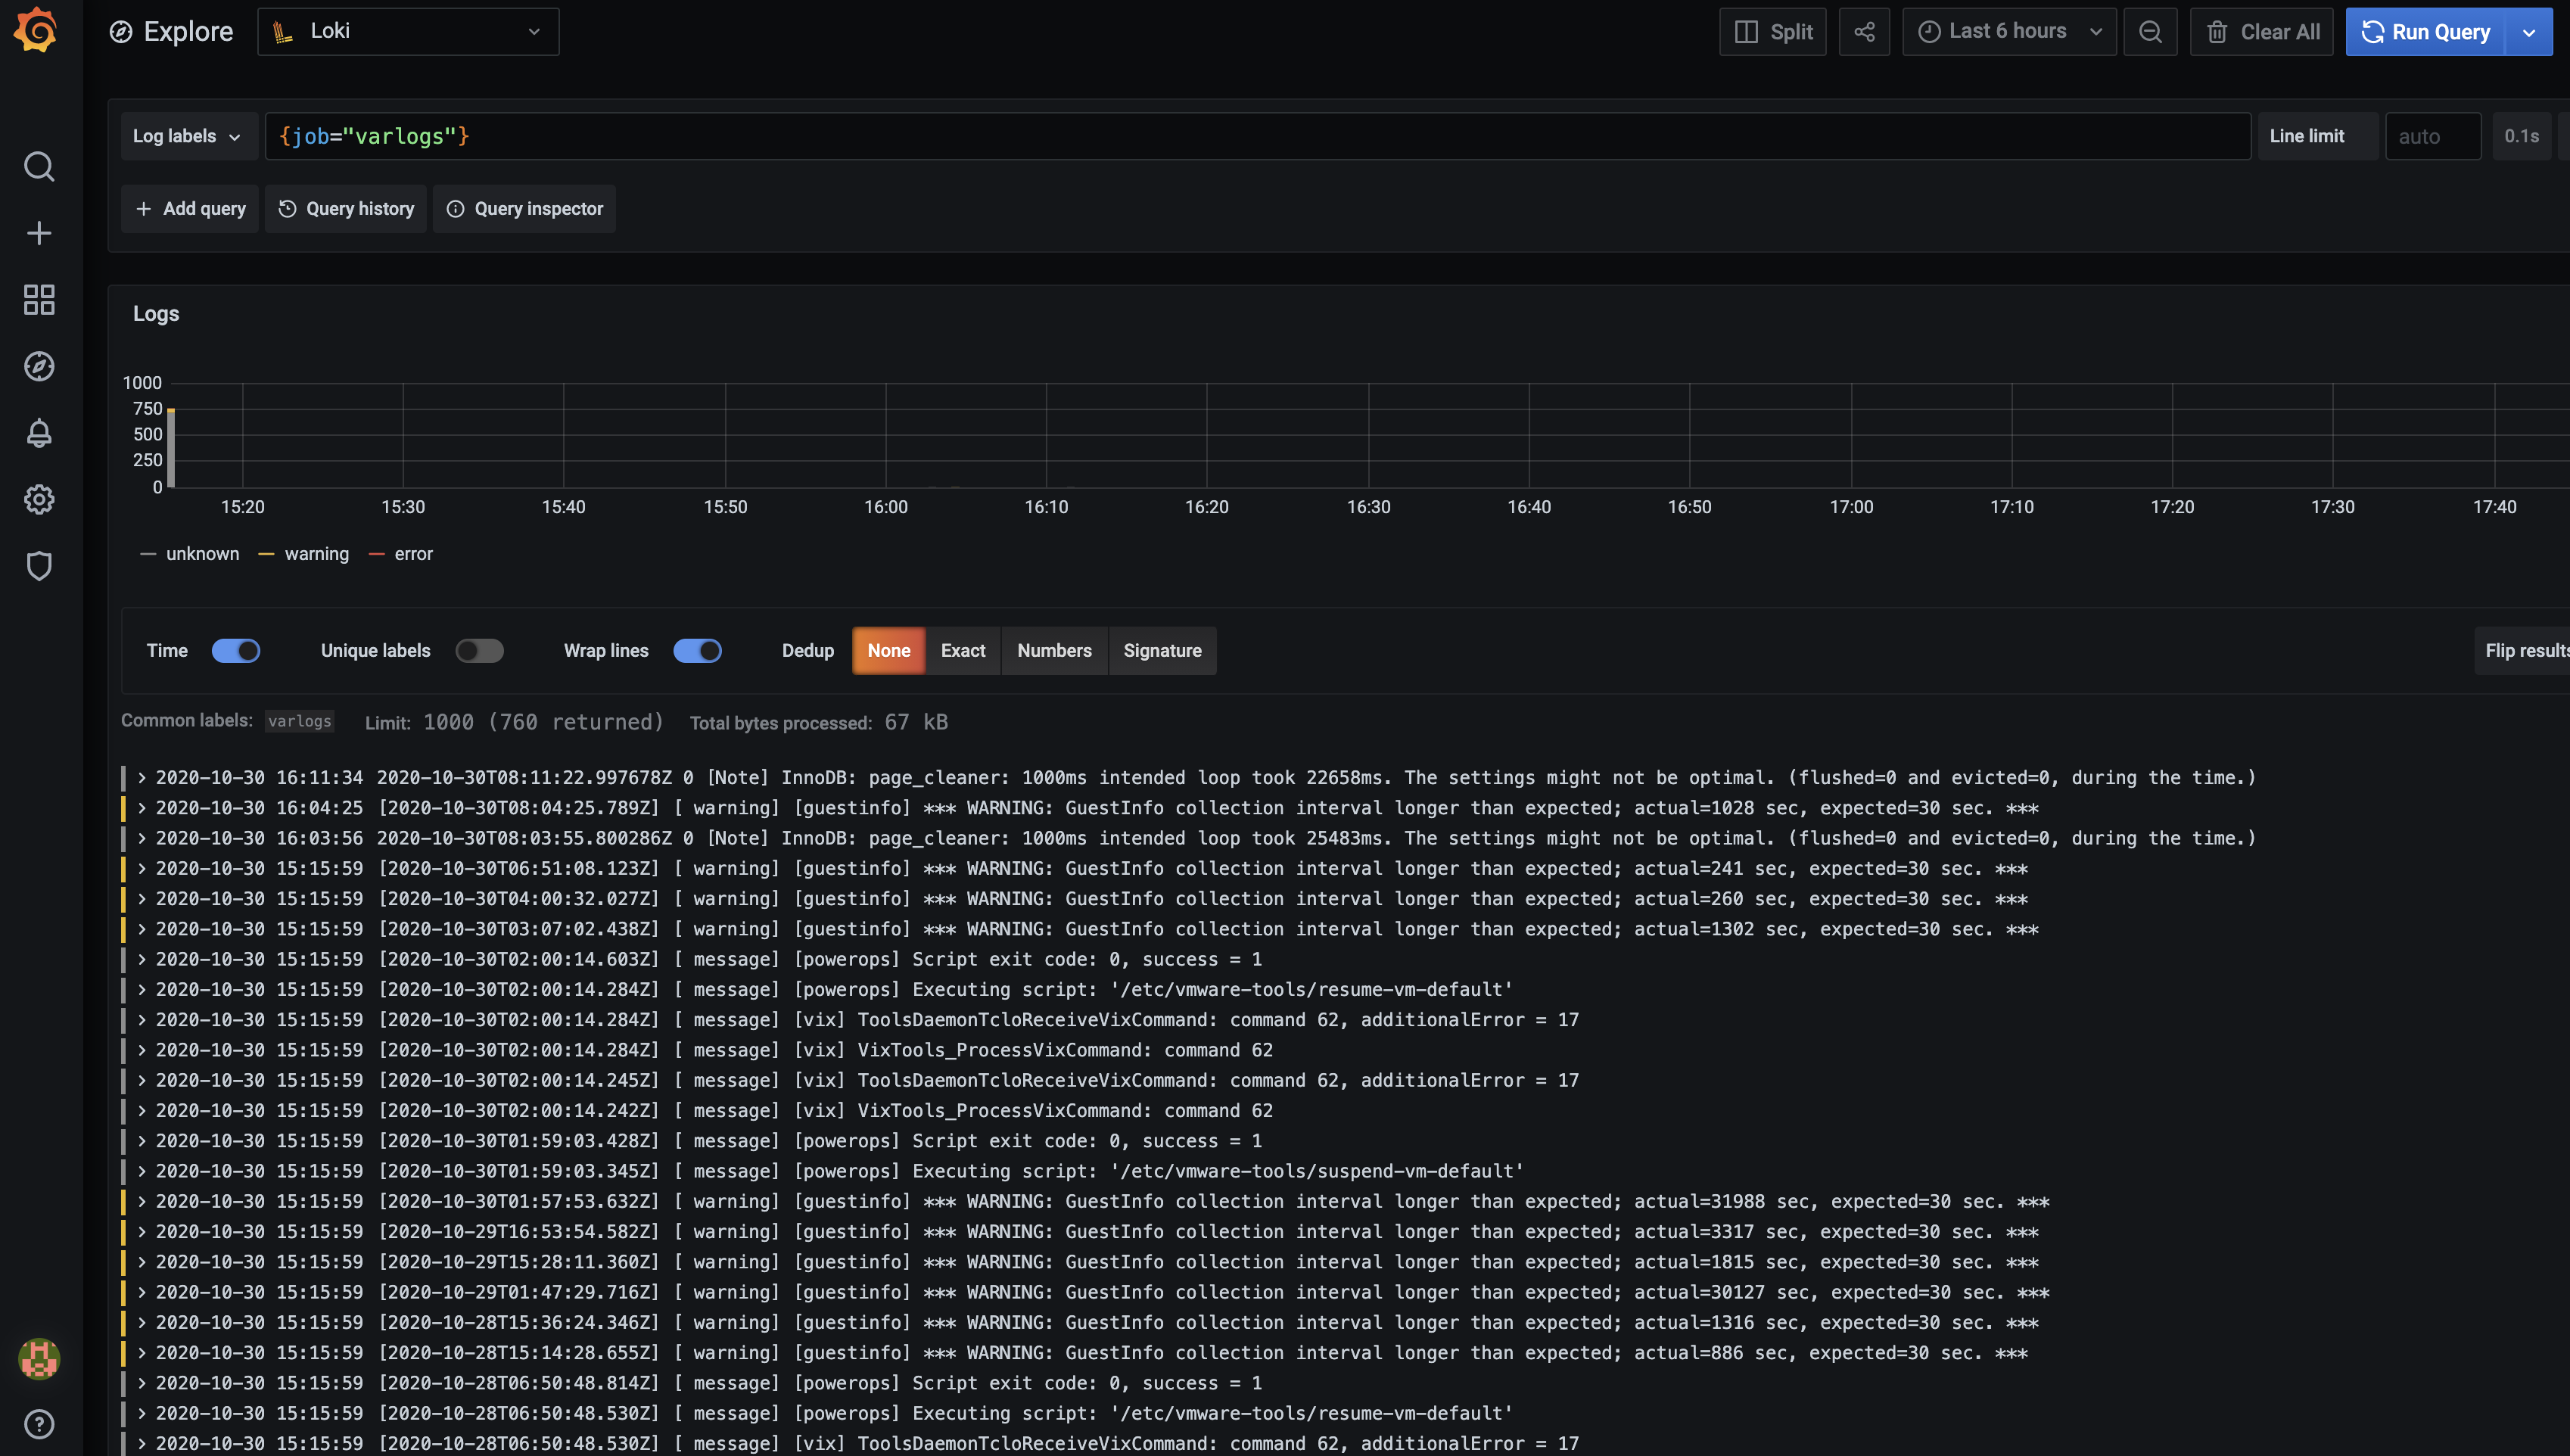
grafana-loki-logs
这里展示的是promtail容器里面/var/log目录中的日志
promtail容器/etc/promtail/config.yml
1 | server: |
这里的job就是varlog,文件路径就是/var/log/*log
https://raw.githubusercontent.com/grafana/loki/master/cmd/promtail/promtail-local-config.yaml
如果是安装二进制的promtail那就更简单了
https://github.com/grafana/loki/releases
1 | # download promtail binary file |
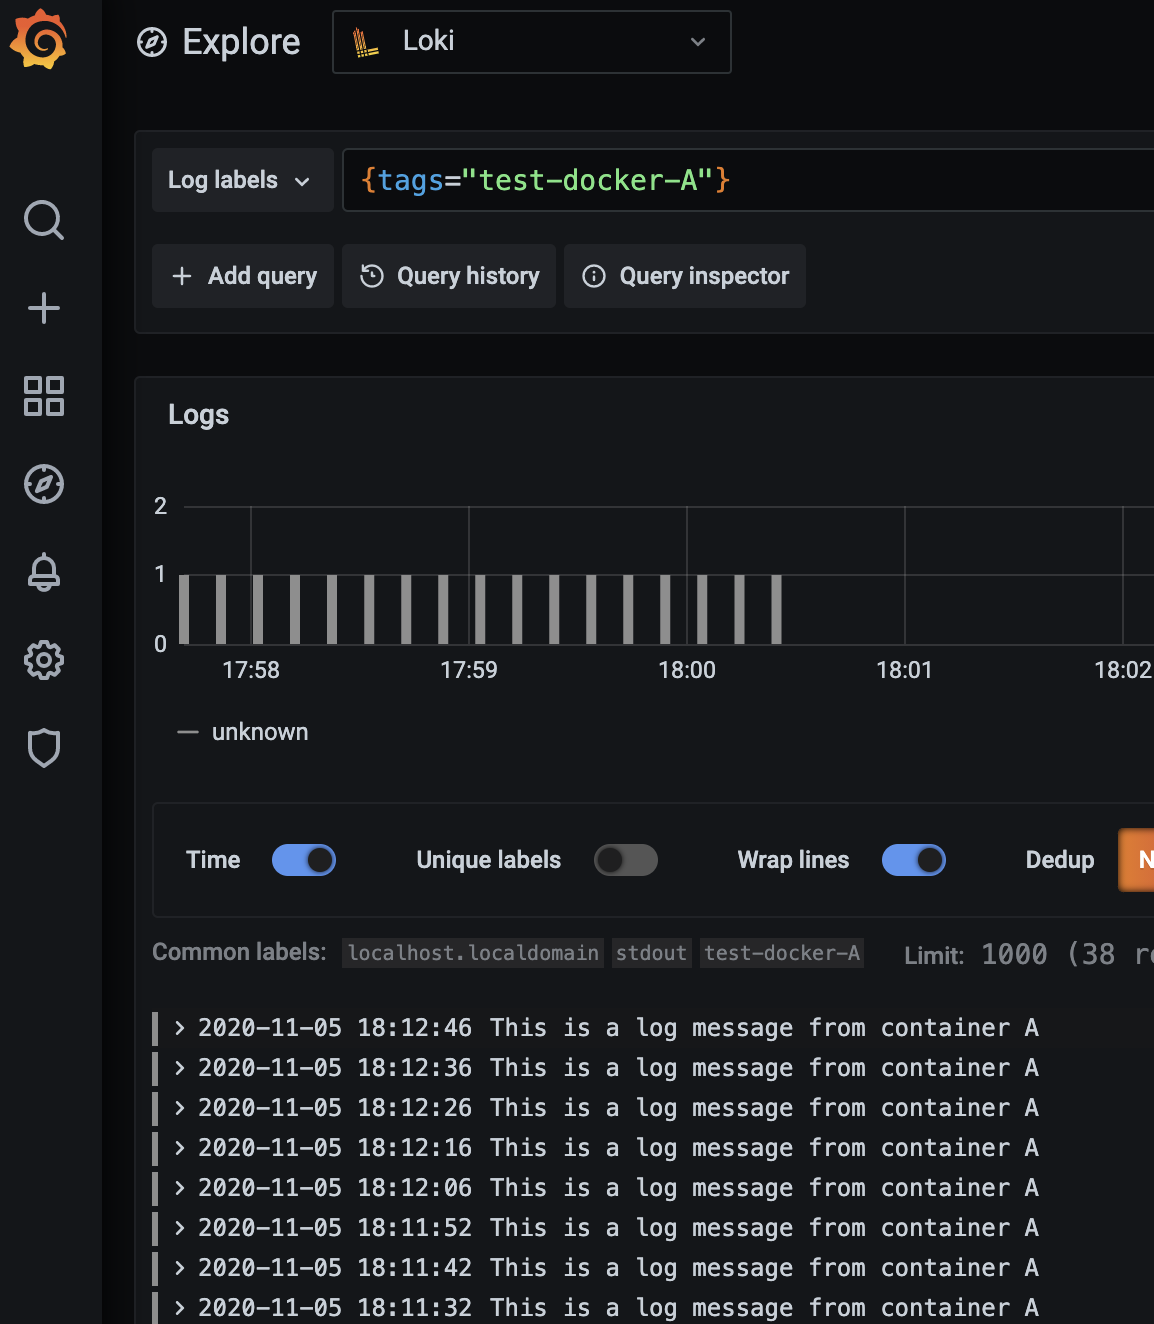
也可以通过修改 docker --log-driver=loki 创建测试日志的容器
1 | docker run -d \ |
https://grafana.com/docs/loki/latest/clients/docker-driver/configuration/
配置
从上面的步骤已经可以一窥使用方法了,如果要使用起来,我们还需要了解如下信息:
Loki的配置
Loki的详细配置,可查看官方文档:
Loki is configured in a YAML file (usually referred to as loki.yaml ) which contains information on the Loki server and its individual components, depending on which mode Loki is launched in.
1 | auth_enabled: false |
https://raw.githubusercontent.com/grafana/loki/master/cmd/loki/loki-local-config.yaml
Configuration examples can be found in the Configuration Examples document.
promtail的配置
promtail 是 Loki 的官方支持的日志采集端,在需要采集日志的节点上运行采集日志,再统一发送到 Loki 进行处理。我们编写的大多是这一部分。
官方配置说明: https://grafana.com/docs/loki/latest/clients/promtail/
除了使用Promtail,社区还有很多采集日志的组件,比如fluentd、fluent bit等,都是比较优秀的。
Loki supports the following official clients for sending logs:
Promtail
Promtail is the client of choice when you’re running Kubernetes, as you can configure it to automatically scrape logs from pods running on the same node that Promtail runs on. Promtail and Prometheus running together in Kubernetes enables powerful debugging: if Prometheus and Promtail use the same labels, users can use tools like Grafana to switch between metrics and logs based on the label set.
Promtail is also the client of choice on bare-metal since it can be configured to tail logs from all files given a host path. It is the easiest way to send logs to Loki from plain-text files (e.g., things that log to /var/log/*.log).
Lastly, Promtail works well if you want to extract metrics from logs such as counting the occurrences of a particular message.
Docker Logging Driver
When using Docker and not Kubernetes, the Docker logging driver for Loki should be used as it automatically adds labels appropriate to the running container.
Fluentd and Fluent Bit
The Fluentd and Fluent Bit plugins are ideal when you already have Fluentd deployed and you already have configured Parser and Filter plugins.
Fluentd also works well for extracting metrics from logs when using its Prometheus plugin.
Logstash
If you are already using logstash and/or beats, this will be the easiest way to start. By adding our output plugin you can quickly try Loki without doing big configuration changes.
选择器和过滤器
选择器 Log Stream Selector
对于查询表达式的标签部分,将其包装在花括号中{},然后使用键值对的语法来选择标签,多个标签表达式用逗号分隔,比如:
1 | {app="mysql",name="mysql-backup"} |
目前支持以下标签匹配运算符:
=等于!=不相等=~正则表达式匹配!~不匹配正则表达式
比如:
1 | {name=~"mysql.+"} |
适用于Prometheus标签选择器规则同样也适用于Loki日志流选择器。
过滤器 Filter Expression
编写日志流选择器后,您可以通过编写搜索表达式来进一步过滤结果。搜索表达式可以只是文本或正则表达式。
查询示例:
1 | {job="mysql"} |= "error" |
过滤器运算符可以被链接,并将顺序过滤表达式-结果日志行将满足每个过滤器。例如:
{job="mysql"} |= "error" != "timeout"
已实现以下过滤器类型:
- |= 行包含字符串。
- != 行不包含字符串。
- |~ 行匹配正则表达式。
- !~ 行与正则表达式不匹配。 regex表达式接受RE2语法。默认情况下,匹配项区分大小写,并且可以将regex切换为不区分大小写的前缀(?i)。
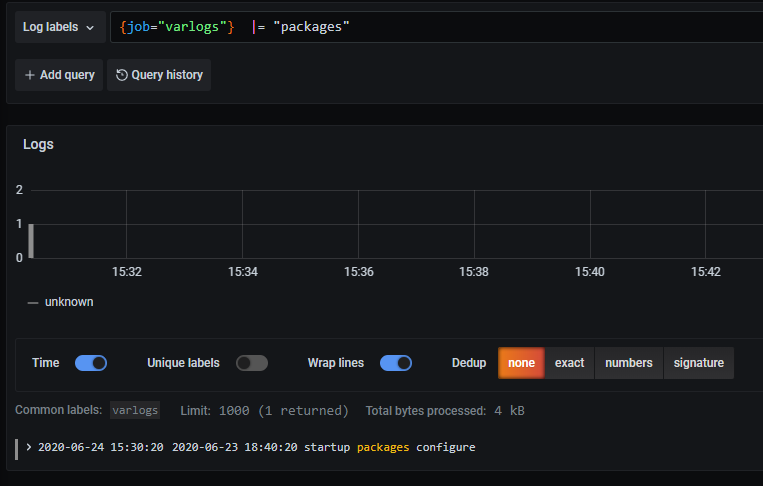
举例,我需要查询包含关键字packages
{job="varlogs"} |= "packages"
效果如下:
想要了解Loki的原始设计文档的可以点击查看这里的文档:Loki设计文档
Loki Cheat Sheet
See your logs
Start by selecting a log stream from the Log labels selector.
Alternatively, you can write a stream selector into the query field:
{job="default/prometheus"}
Here are some example streams from your logs:
{job="varlogs"}
Combine stream selectors
{app="cassandra",namespace="prod"}
Returns all log lines from streams that have both labels.
Filtering for search terms.
{app="cassandra"} |~ "(duration|latency)s*(=|is|of)s*[d.]+"
{app="cassandra"} |= "exact match"
{app="cassandra"} != "do not match"
LogQL supports exact and regular expression filters.
Count over time
count_over_time({job="mysql"}[5m])
This query counts all the log lines within the last five minutes for the MySQL job.
Rate
rate(({job="mysql"} |= "error" != "timeout")[10s])
This query gets the per-second rate of all non-timeout errors within the last ten seconds for the MySQL job.
Aggregate, count, and group
sum(count_over_time({job="mysql"}[5m])) by (level)
Get the count of logs during the last five minutes, grouping by level.
LogQL
Loki 使用一种称为 LogQL 的语法来进行日志检索,语法类似 PromQL
LogQL: Log Query Language
Loki comes with its own PromQL-inspired language for queries called LogQL. LogQL can be considered a distributed grep that aggregates log sources. LogQL uses labels and operators for filtering.
There are two types of LogQL queries:
- Log queries return the contents of log lines.
- Metric queries extend log queries and calculate sample values based on the content of logs from a log query.
受PromQL的启发,Loki也有自己的LogQL查询语句。根据官方的说法,它就像一个分布式的grep日志聚合查看器。和PromeQL一样,LogQL也是使用标签和运算符进行过滤,它主要分为两个部分:
- log stream selector (日志流选择器)
- filter expression (过滤器表达式)
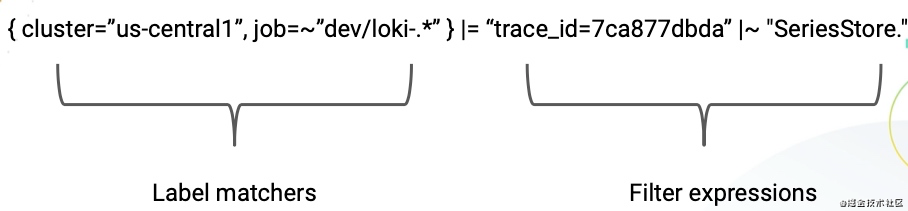
我们用这两部分就可以在Loki中组合出我们想要的功能,通常情况下我们可以拿来做如下功能
- 根据日志流选择器查看日志内容
- 通过过滤规则在日志流中计算相关的度量指标
Log Stream Selector
日志流选择器这部分和PromQL的语法一样,主要也是通过采集上来的日志label来确定你要查询的日志流。通常label的匹配运算支持以下几种:
=: 完全匹配
!=: 不匹配
=~: 正则表达式匹配
!~: 正则表达式不匹配
{app=”mysql”,name=~”mysql-backup.+”}
=: exactly equal.!=: not equal.=~: regex matches.!~: regex does not match.
Filter Expression
{instance=~"kafka-[23]",name="kafka"} != "kafka.server:type=ReplicaManager"
|=: Log line contains string.!=: Log line does not contain string.|~: Log line matches regular expression.!~: Log line does not match regular expression.
Metric Queries
这个其实就跟prometheus中的很想像了.
rate({job="mysql"} |= "error" != "timeout" [5m])
rate: calculates the number of entries per secondcount_over_time: counts the entries for each log stream within the given range.bytes_rate: calculates the number of bytes per second for each stream.bytes_over_time: counts the amount of bytes used by each log stream for a given range.
Aggregation operators
当然还支持一些聚合操作,比如
avg(rate(({job="nginx"} |= "GET")[10s])) by (region)
sum: Calculate sum over labelsmin: Select minimum over labelsmax: Select maximum over labelsavg: Calculate the average over labelsstddev: Calculate the population standard deviation over labelsstdvar: Calculate the population standard variance over labelscount: Count number of elements in the vectorbottomk: Select smallest k elements by sample valuetopk: Select largest k elements by sample value
还有很多比如’and, or’的操作都是支持, 就不一一搬运了
https://grafana.com/docs/loki/latest/logql/
promtail-nginx
vim promtail-nginx.yml
1 | server: |
vim promtail-nginx-pipeline.yml
1 | server: |
Querying Logs with LogQL
1 | {app="nginx"} |= "GET" |
To search for a certain string in the results, you can use a search expression. This can be just text matching by using |= or a regex expression by using |~. And by using a ! instead of the pipe, the expression can be negated. Here are some examples:
1 | {app="nginx"} |= "GET" |
For more details, please refer to the Loki documentation.
https://grafana.com/docs/loki/latest/clients/promtail/pipelines/
模拟日志生成压力测试工具
https://github.com/elastic/rally
https://pypi.org/project/log-generator/
https://github.com/mingrammer/flog
参考文章
Loki: Prometheus-inspired, open source logging for cloud natives
